Stacked lineprofiles
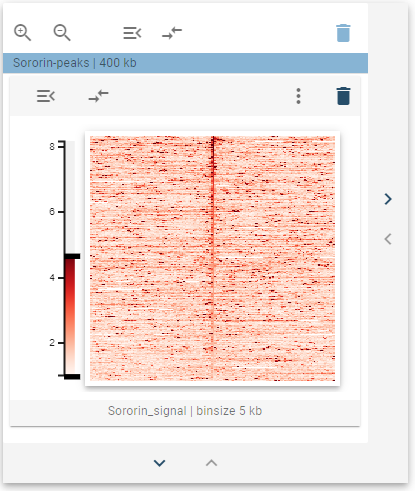
The stacked line profile widget can be used to display individual examples of 1D-genomic features over a specific region set. It is a heatmap representation, where each row corresponds to one genomic region.
The stacked line profile widget does not show the entirety of the selected region-set, but only a subset. The down-sampling ratio can be defined as configuration variable (see the configuration section for details)
Suitable data
The stacked line profile widget is suitable for any genomic dataset that can be represented using a bigwig file. This includes coverage tracks for Chip-seq experiments, Gro-seq experiments, but also features derived from Hi-C data such as insulation scores.
Preprocessing algorithm
The preprocessing algorithms are very similar to the ones used in the 1D-average widget
Point-regions
Snippets are extracted from the respective bigwig file for each entry in the genomic region set, with different window sizes during the preprocessing stage. These snippets are then stacked row-wise into a matrix.
Interval-regions
Snippets are extracted from the respective bigwig file for each entry in the genomic region set during the preprocessing stage. In contrast to the point-region preprocessing, the snippets are defined by each region’s start and end. Before stacking, each snippet is scaled to have the same number of bins.
Visualization
The stacked line profile widget displays aggregated data sets as a heatmap. The color scale used to display the values is dynamic and can be adjusted with the sliders at the top and bottom of the color bar.
Widget controls
The stacked line profile widget defines two widget controls, one for specifying the sort order of the rows and the other for sharing value scales between widgets.
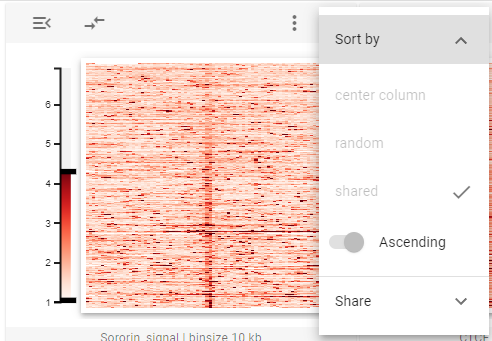
Sort order
The sort order widget control option specifies which values to sort and whether to sort in an ascending or descending fashion.
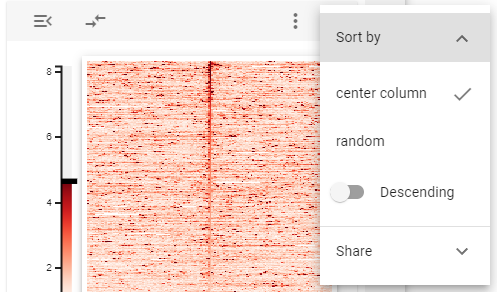
For point-regions, the sort values are the following:
- Center column | sort by the center column
- Random | shuffle rows
For interval regions, the sort values are the following:
- Region | sort by the average value of the continued region (between start and end)
- Left boundary | sort by left boundary
- Right boundary | sort by right boundary
- Random | shuffle rows
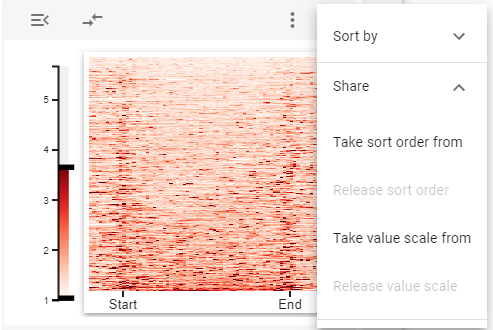
Sharing
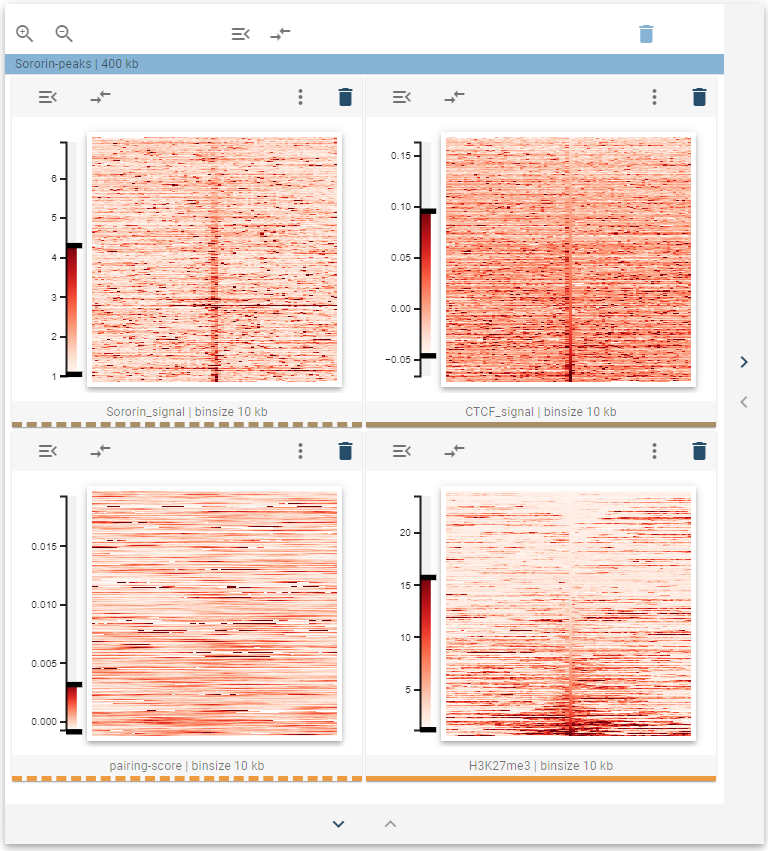
The stacked line profile widget supports sharing value scales in a similar fashion to the 2d-average widget. In addition, the stacked line profile widget allows sharing sort-order between widgets that reside in the same widget collection. For this, click on “Take sort order from” then click on the target widget.
After that, a colored line under the stacked line profile indicates that the two widgets are linked. The sort order donor has a continuous colored line, whereas the sort order acceptor has a dashed colored line.
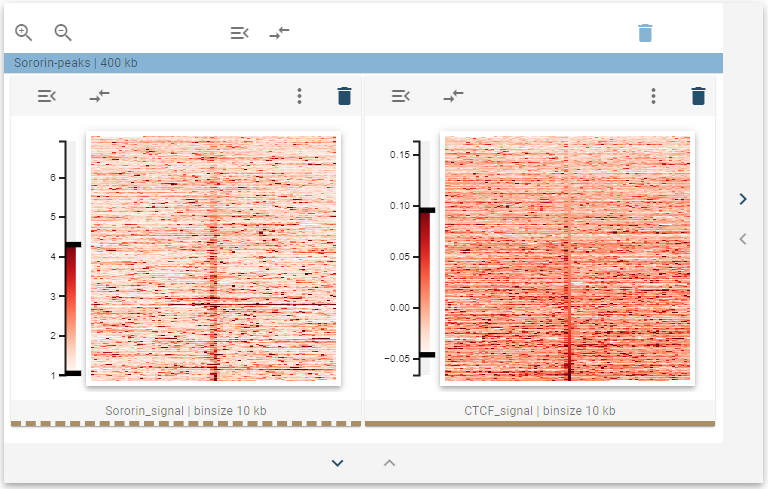
The sort order acceptance widgets can now no longer change their sort orders, and their sort order is set to share.
When the sort order is changed on the donor widget, however, all acceptor widgets follow the suite. You can link multiple widgets together by taking the sort order of a shared donor. You can also link multiple widgets independently, which are then marked by differently colored color lines.
If you want to stop sharing sort orders, you can select “Release sort order” on the sort order acceptor.