Features
Genomic features are an essential part of the region-set focus approach and are defined as 1D- or 2D-continuous data that is mapped to a genomic coordinate system. Examples are ChiP-seq read density, Hi-C interaction values, and GRO-seq tracks. Genomic features are mainly used to understand genomic regions in the context of the region-set focus approach. They can thus be thought of as “independent variables” that are used to explain the “dependent” genomic regions.
Data requirements
Bigwig files (1D-features)
Bigwig files should conform to the Bigwig-standard, which translates to being readable by bigwig interface libraries (in our case, this is pybbi). In addition, your bigwig file should contain data that were aligned against the selected genome assembly. But as for BED-files, this is a requirement we can only check to a limited degree.
Always check that your bigwig file was derived from data that were aligned against the selected genome assembly!
Multiresolution Cooler files (2D-features)
HiCognition can load 2D-genomic features from multiresolution cooler files. Here, they same cautionary notes with respect to genome assemblies apply. In addition, mcool files need to contain the resolutions defined in the flask configuration file. For the default setting these are:
- 5000
- 10000
- 20000
Note that we consciously don’t try to search for the nearest fitting resolution as this would compromise comparability between genomic features. If you need a primer on how to create mcool files and what strategies for data normalization are available, see the cooler documentation.
Always check that your cooler file is compatible with the defined resolution restrictions!
Description of genomic features
To allow efficient filtering and searching as well as an easier display of genomic features, we defined a formal description that is exposed to the user when adding and viewing genomic features.
1D-features
The structure of the description fields for 1D features can be seen in the following graph:
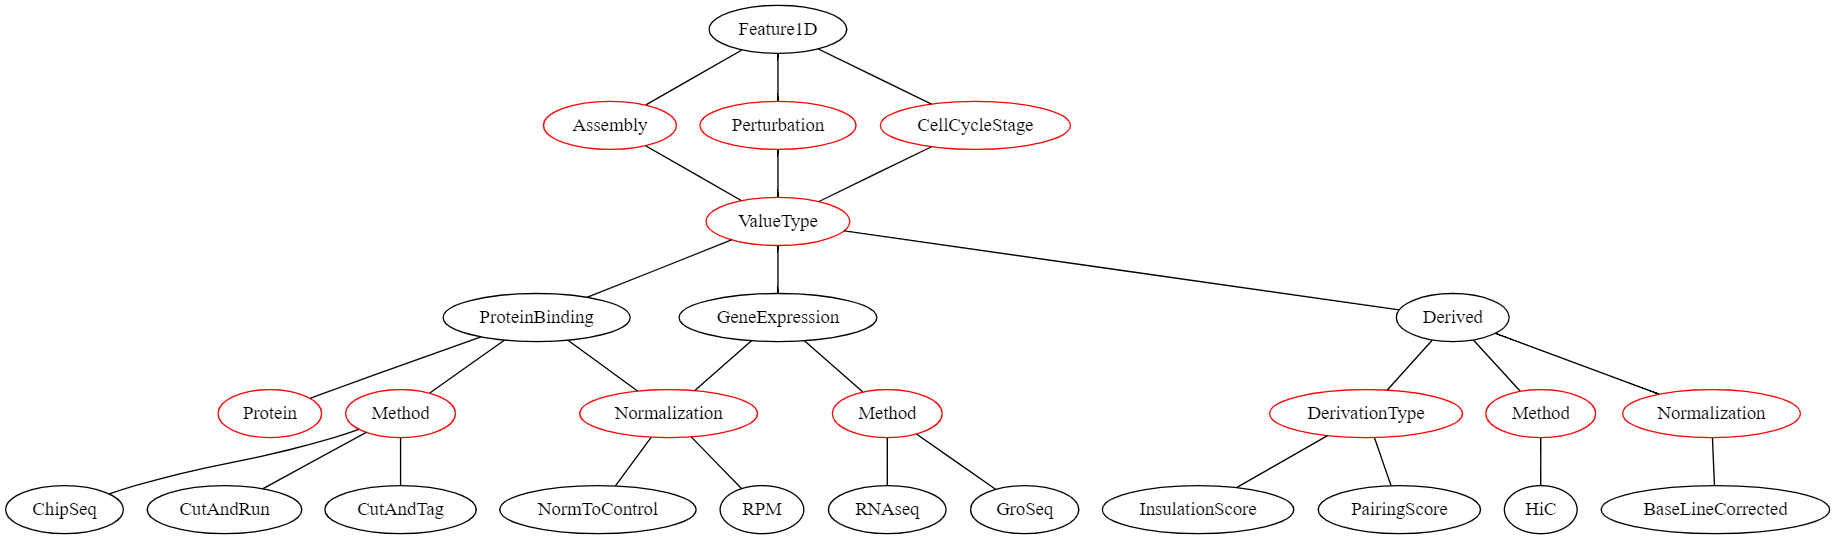
In this graph, all nodes representing a value that the user can select are red. If the user’s selection can lead to different selections lower in the graph, these options are displayed as black nodes. The first children of Feature1D are fields that need to be defined for all region sets and have no influence on the later selection hierarchy:
- Assembly | The genome assembly this feature set belongs to
- Perturbation | The perturbation condition (or none) that was used in the experiment that led to this dataset
- CellCycleStage | The cell cycle stage the cells were in when the data was collected
Then, the ValueType needs to be selected. This describes what kind of genomic feature this dataset are. This can be one of the following:
- ProteinBinding | A dataset that represents that binding of a protein (e.g., derived from Chip-seq or CutandRun)
- GeneExpression | A dataset that represents gene expression (e.g., derived from GRO-seq)
- Derived | A dataset that was derived from another dataset (e.g., insulation score in Hi-C)
Selection of a specific ValueType leads to different required metadata downstream. E.g., if the ValueType is ProteinBinding, then the Protein field needs to be filled out.
2D-features
The structure of the description fields for 2D features can be seen in the following graph:
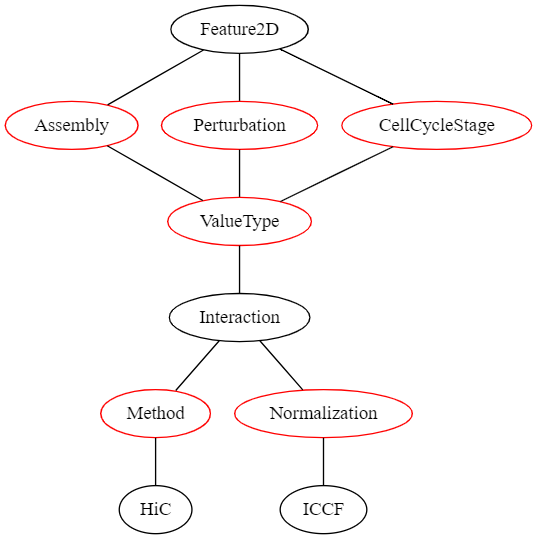
In this graph, all nodes representing a value that the user can select are red. If the user’s selection can lead to different selections lower in the graph, these options are displayed as black nodes. The first children of Featur2D are fields that need to be defined for all region sets and have no influence on the later selection hierarchy:
- Assembly | The genome assembly this feature set belongs to
- Perturbation | The perturbation condition (or none) that was used in the experiment that led to this dataset
- CellCycleStage | The cell cycle stage the cells were in when the data was collected
2D features currently only define a single ValueType:
- Interaction | A dataset that contains a quantification of genome interactions
Thus, the other fields are determined when uploading a 2D-feature dataset.
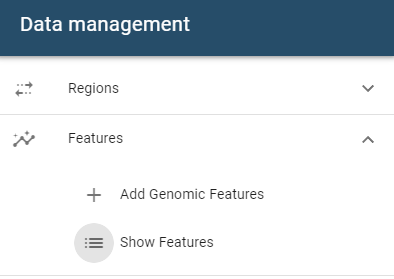
Adding genomic features
The addition of genomic features can be started by clicking on the Add genomic features button in the data management drawer:
This will open a dialogue that follows the same principles as the dialogue described for addition of genomic regions.
Genomic features are typically much larger in size than genomic regions. This will cause the upload to take longer!
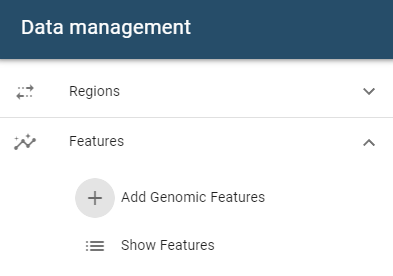
Managing genomic features
Managing genomic features is equivalent to managing genomic regions, except that the table component is launched from a different menu button: