Association
The association widget allows you to determine what other genomic regions are enriched at your target genomic region set. It contains two visualizations that give you an overview of where the most enrichment happens (upper plot) and what is enriched at those sites (lower plot).
Suitable data
The association widget is suitable for a collection of genomic regions (see here for more information about collections).
Preprocessing algorithm
Point-regions
During the preprocessing stage, the LOLA algorithm is run for each bin along the specific windowsize. This means that a contingency table is built for each bin and candidate region that represents the overlap of the query region (the selected region set), a suitable universe, and a candidate target region (one entry in the region collection).
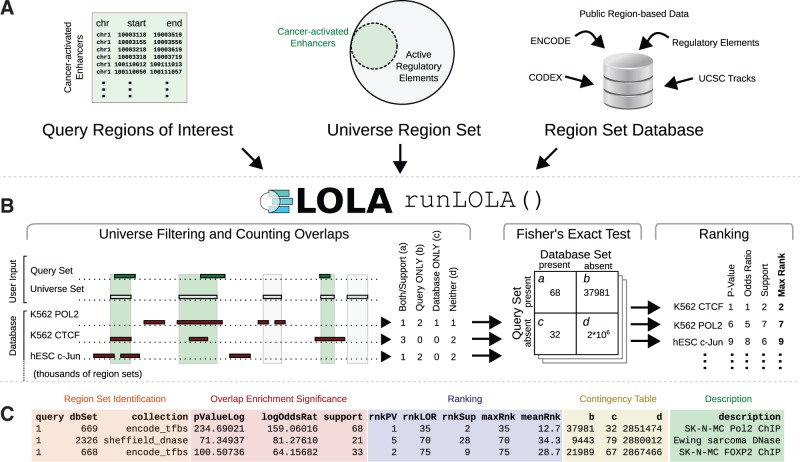 Sheffield et al. 2016
In this preprocessing step, the universe is defined to be all bins of the selected binsize along the entire genome.
Interval-regions
Preprocessing for interval regions works the same as for point-regions except that the query bins have different sizes, and the universe is the union of all query regions.
The particular selection of the enrichment universe for interval-regions means that enrichment is relative to the selected region-sets! This means that uniform enrichments across all selected regions may be lower in magnitude.
Visualization
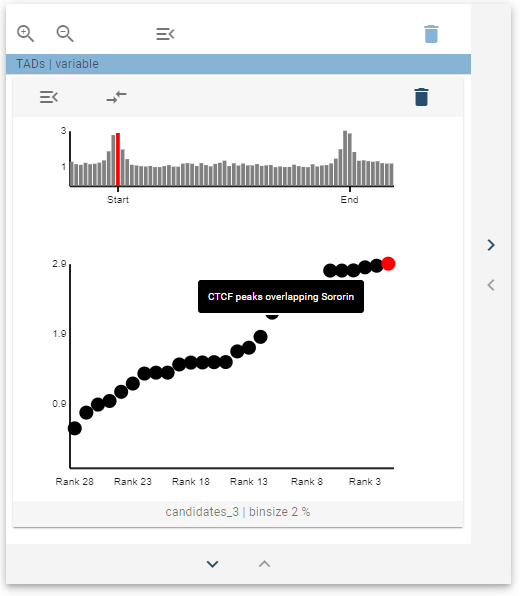
The association widget consists of two main visualizations, the enrichment overview at the top and the ranked enrichments at the bottom. The enrichment overview represents the maximum enrichment at that particular genomic bin amongst all regions in the region-set. It can be thought of as a measure of how much the respective collection exhibits enrichment.
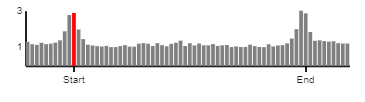
The overview widget is simultaneously a control point since it allows the data selection to show in the rank plot below. Here, the currently selected bin is highlighted in red, and clicking on other bars shifts the selection. The rank-plot below shows the odds ratio of the respective members of the selected region collection ranked from lowest to highest. If you hover over one of the points, the name of the respective region set is displayed.
![]()