Regions
Genomic regions are the central element of the region-set focus approach and are represented in practice by BED or BEDPE files that the user uploads to the server.
Data requirements
A requirement that you are responsible for yourself is that the BED- and BEDPE-files conform to the selected genome assemblies (see the genome assemblies section for more information). HiCognition won’t crash when preprocessing assembly-incompatible BED- or BEDPE-files, but will emit blank data for those regions. HiCognition won’t check whether positions within the bounds of a given assembly are actually derived from that assembly!
Always check that your BED- and BEDPE-files contain coordinates that fit the selected genome assemblies!
BED-Files
BED-files should conform to the BED-standard, meaning that they should contain all required BED fields with tab-separated entries:
chromchromStartchromEnd
BED-files may contain column names in the first line.
They are also allowed to contain comment lines (containing a leading #) as well as track and browser lines, such as:
# This is my favorite file
track name=pairedReads description="Clone Paired Reads" useScore=1
chr22 1000 5000 cloneA 960 + 1000 5000 0 2 567,488, 0,3512
chr22 2000 6000 cloneB 900 - 2000 6000 0 2 433,399, 0,3601
BEDPE-Files
Contrary to BED-files, BEDPE-files contain two positions along the genome.
BEDPE-files should conform to the BEDPE-Format, meaning that they should contain all required BEDPE fields with tab-separated entries:
chrom1start1end1chrom2start2end2
BEDPE-files follow the same specification as BED-files for comments, track and browser lines.
Types of genomic regions
HiCognition supports two different types of genome regions that will be preprocessed and displayed differently. For a description of how the visualizations adapt to the different types of genomic regions, see the widget section.
Point regions
HiCognition treats point regions as points in the genome.
This means that internally, the start and end fields will be collapsed into a single position that represents the center of that region.
This region type is suitable when the features you look at likely have no internal structure through the span of your regions.
Examples here are Chip-seq peaks of transcription factors, transcriptional start sites of genes, or boundaries of topologically associating domains.
When working with point regions, HiCognition will create views with different window sizes around these point regions to allow exploration of multiple length scales.
Windowsize
                                         Point
   Small                              -----|-----
     |
     |                                   Point
     |                       --------------|--------------
     |
     |                                   Point
     |                 --------------------|--------------------
     |
     v                                   Point
   Large       ----------------------------|----------------------------
To reduce computational load, the binsizes at which features are aggregated, get smaller when windowsizes get larger. The particular setting can be changed in the configuration files of HiCognition (see the configuration section for more details).
Interval regions
HiCognition treats interval regions as regions that have a meaningful start, end and with that size in the genome. This region type is suitable when the features that you look at likely have internal structure through the span of your regions. Treating regions as interval regions is also useful when they have different sizes, and you want to look at features without regard for the region’s size. This is because all preprocessing steps for interval regions change the coordinate system from genomic coordinates to relative coordinates with relation to the size of the regions.
The binsizes that are used to aggregate features are thus defined as a percentage of the interval size. Practically, this means that if you have a particular region that is 1 Mbp in size and another region that is 500 kbp in size, the effective binsize (at 1 %) for the former will be 10 kbp and for the latter 5 kbp. This also means that we interpolate genomic features to fit the target binsize. This is convenient to exclude size effects but can introduce artifacts. So always have that in mind when exploring interval features!
Interval regions will cause genomic features to be scaled to a common size. This can introduce artifacts!
Interval regions are displayed with a little expansion left and right to be able to compare them to a potential baseline:
Left Expansion                 Region             Right Expansion
---------------|---------------------------------|---------------
See the configuration section for how to set the extent of the expansion.
Description of genomic regions
To allow efficient filtering and searching as well as an easier display of genomic regions, we defined a formal description of genomic region sets that is exposed to the user both when adding new regions and when viewing genomic regions. The structure of the description fields of a genomic region set can be seen in the following graph:
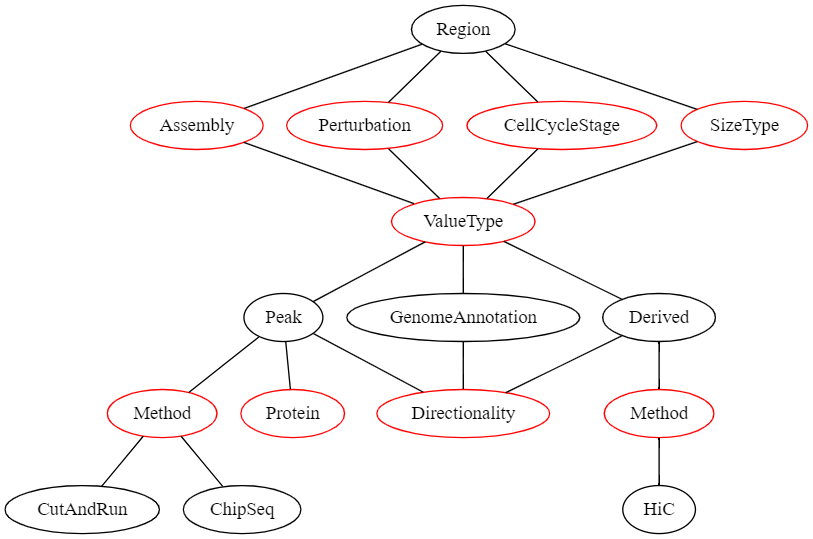
In this graph, all nodes representing a value that the user can select are red.
If the user’s selection can lead to different selections lower in the graph, these options are displayed as black nodes.
The first children of Region are fields that need to be defined for all region sets and have no influence on the later selection hierarchy:
- Assembly | The genome assembly this region set belongs to
- Perturbation | The perturbation condition (or none) that was used in the experiment that led to this dataset
- CellCycleStage | The cell cycle stage the cells were in when the data was collected
- SizeType | Which sizetype (see above) the genomic regions should be treated as
Then, the ValueType needs to be selected.
This describes what kind of genomic regions this dataset is.
This can be one of the following:
- Peak | A peak from an experiment that produces continuous genomic data e.g., ChiP-Seq
- GenomeAnnotation | A genomic region set that is obtained by integrating multiple data sources and human intervention (e.g., genes, transcriptional start sites, etc.)
- Derived | If regions have been derived from a single other dataset (e.g., TADs derived from a Hi-C experiment)
Selection of a specific ValueType leads to different required metadata downstream.
E.g., if the ValueType is Peak than the possible selection of methods is different than when the ValueType is Derived.
Adding genomic regions
Adding genomic regions can be done by uploading a BED-/BEDPE-file. Optional metadata can be added. This can be done for single files or with multiple files using the bulk addition option.
Single addition
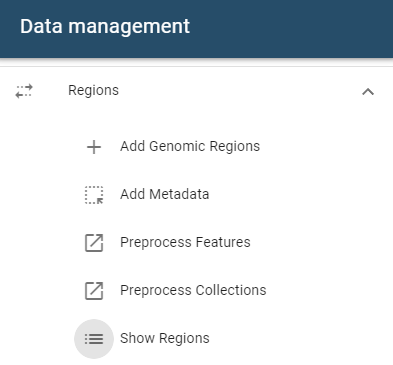
To add a single genomic region set, open the side drawer and click on the add region button:
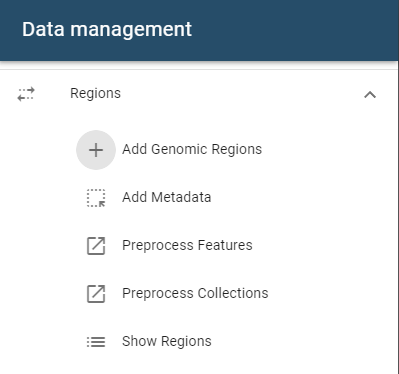
A dialog will open that accepts files from these sources:
- File system
- URL import
- Import from ENCODE repositories such as 4DNucleome
Uploaded files will be checked for validity and may get discarded if they are not of the expected format.
Required infos are: name, genome assembly and size type (interval or point).
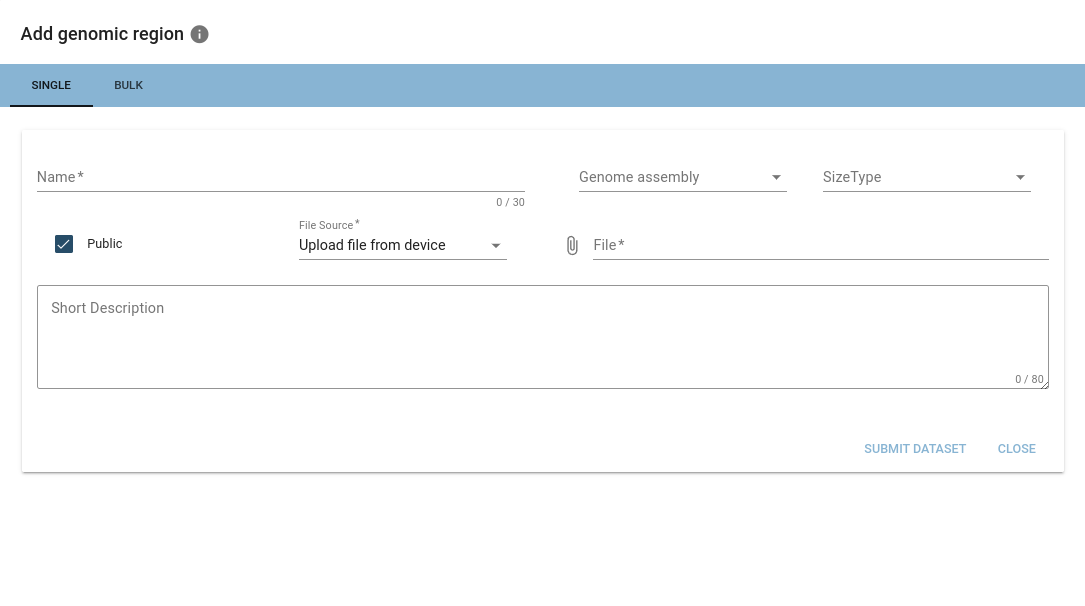
When a valid BED-/BEDPE-file is added, options encapsulating the hierarchical structure described above will appear.
When importing from ENCODE repositories, HiCognition will automatically fill out the associated metadata.
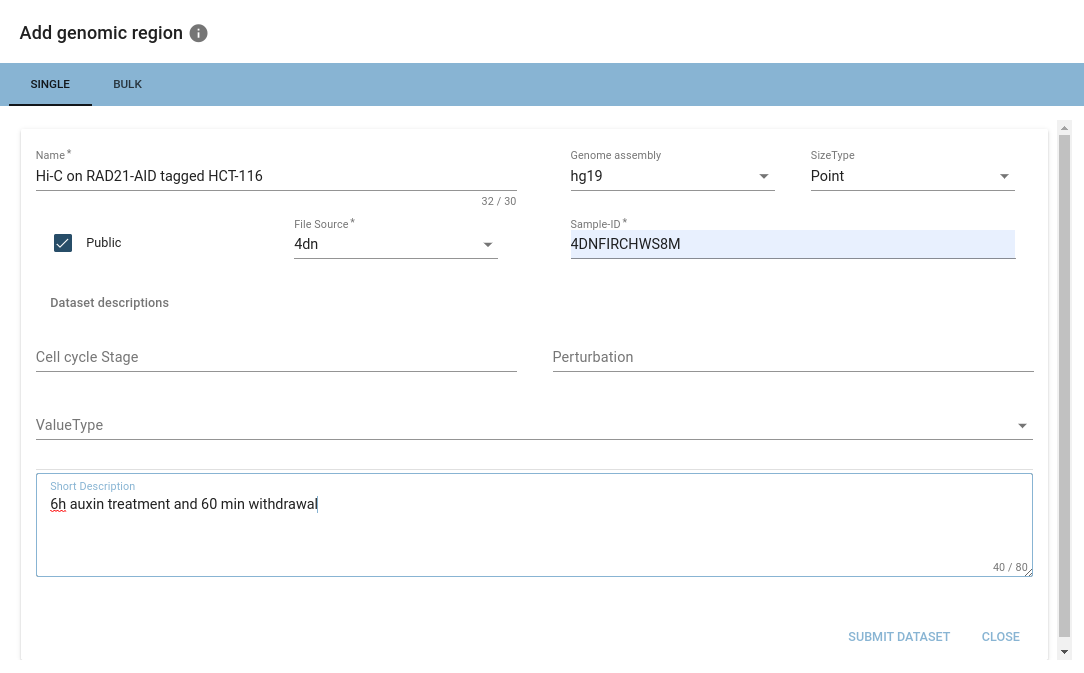
Once you are happy with your selection, you can hit submit, and your dataset will be imported into HiCognition!
Bulk addition
Adding multiple genomic regions at once is possible when uploading from your file system.
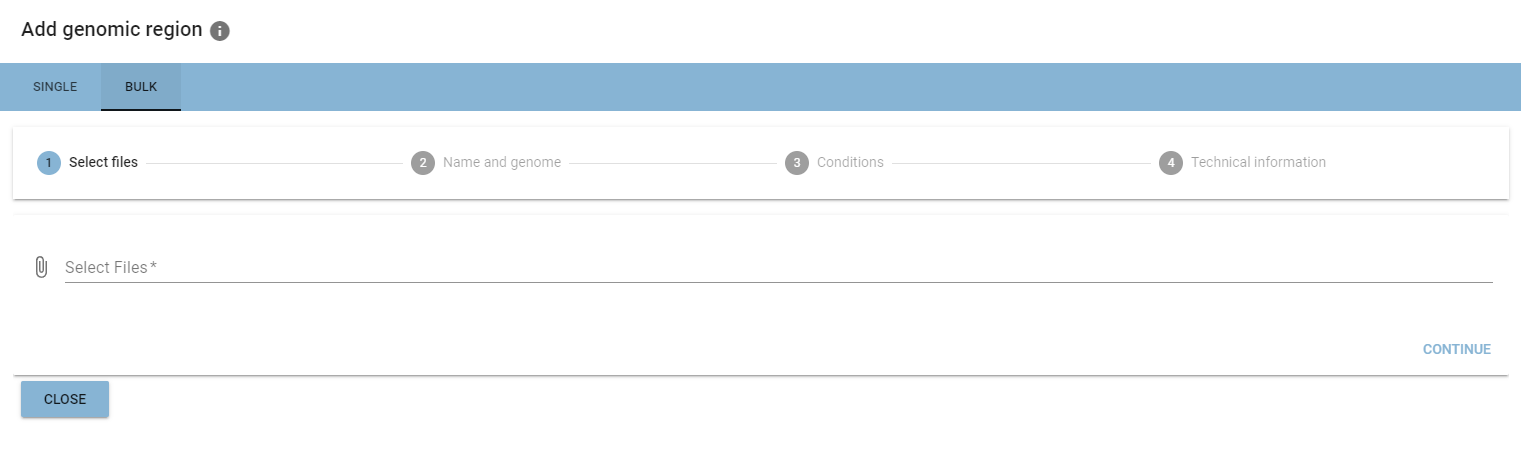
Bulk addition is organized as a multi-step process, where you add the same information as in the single addition at the different positions of the process.
Managing genomic regions
Regions can be managed from the Regions table, accessible via the Show Regions button in the side drawer.
Viewing
A table showing all region sets will open.
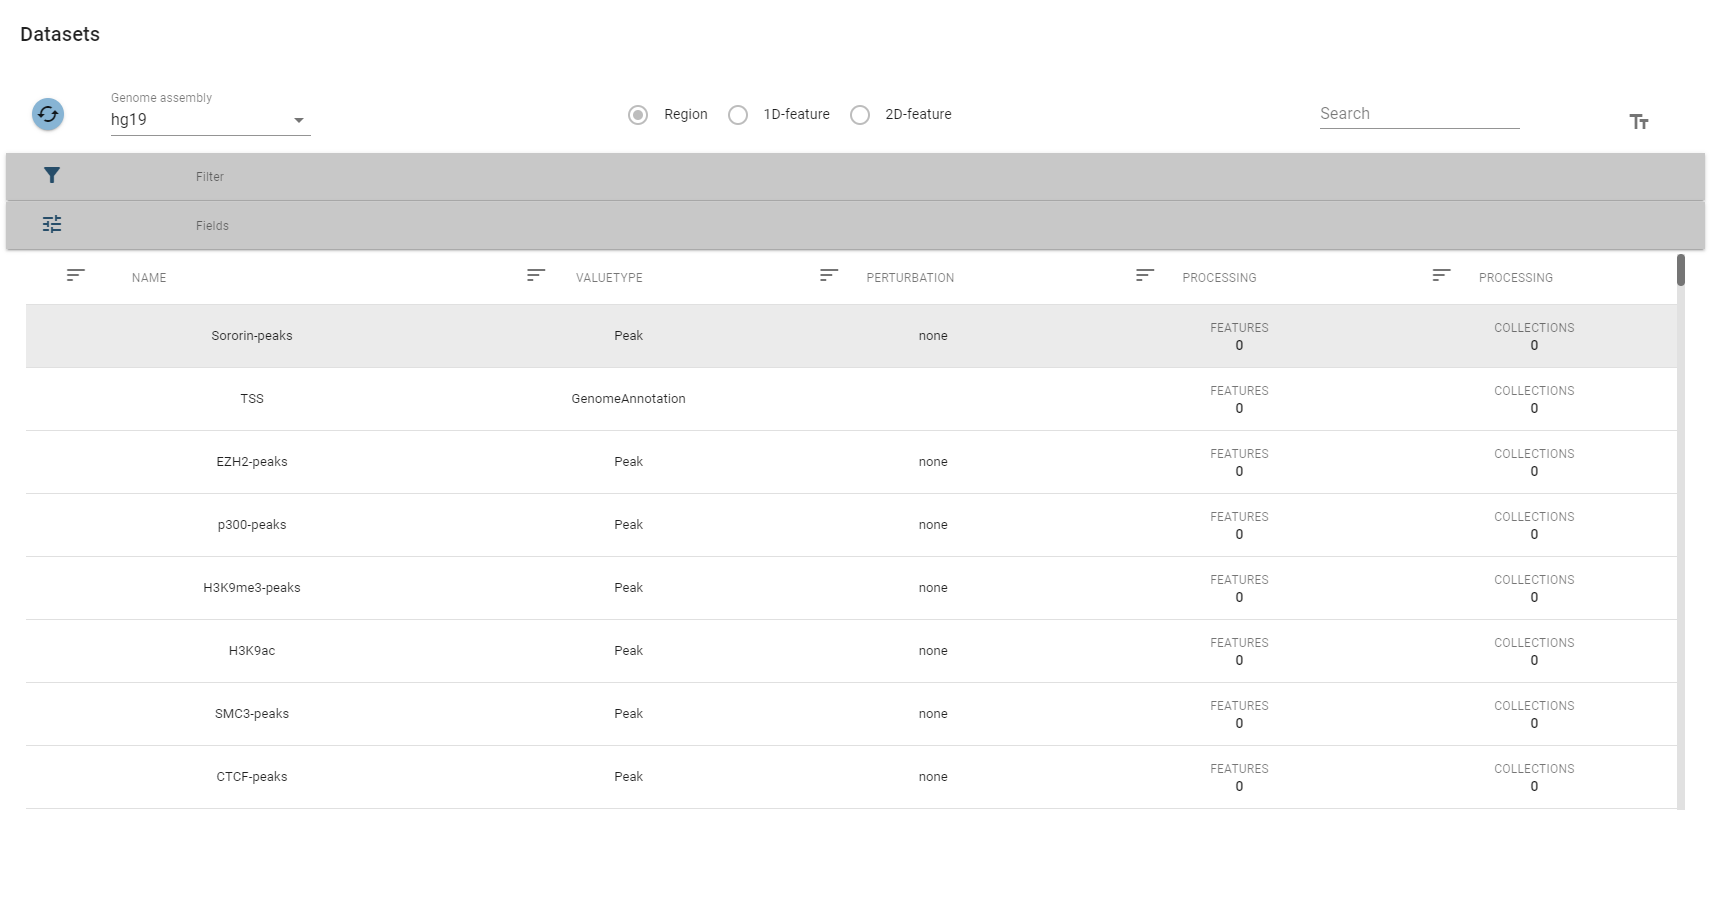
The top-row of this view allows you to select a specific genome assembly and contains a search field that allows for quick filtering of interesting datasets. For more fine-grained control over the filtering process, you can expand the filter box, which displays the description fields mentioned above.
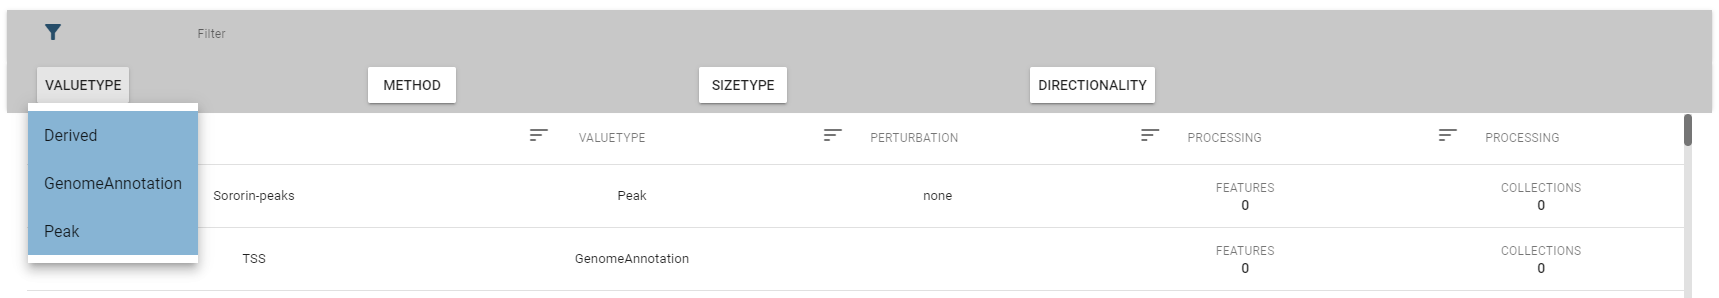
Per default, only a subset of fields are displayed, but you change this in the fields box:
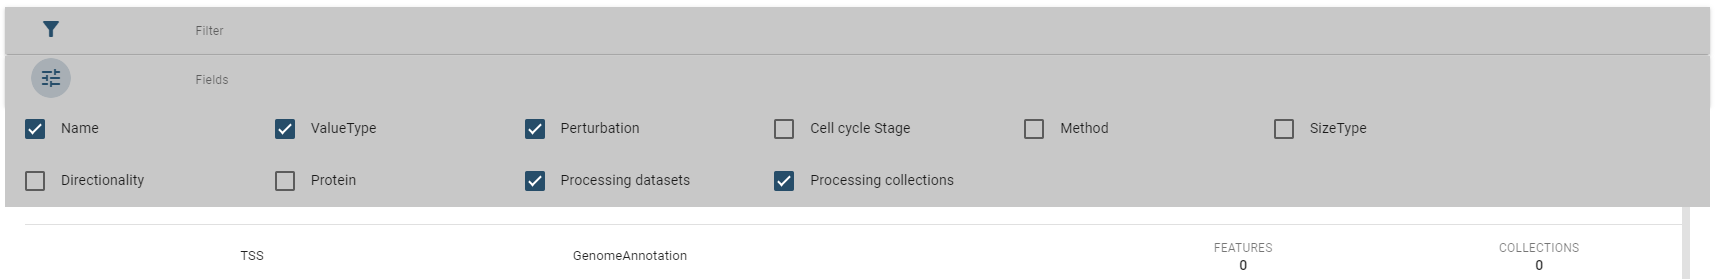
For every type of dataset (region sets, 1d features, 2d features) similar tables are used.
Editing
You can edit the description fields and name of a dataset by selecting it in the table component and then hitting the Edit button.
This will display the edit dialogue:
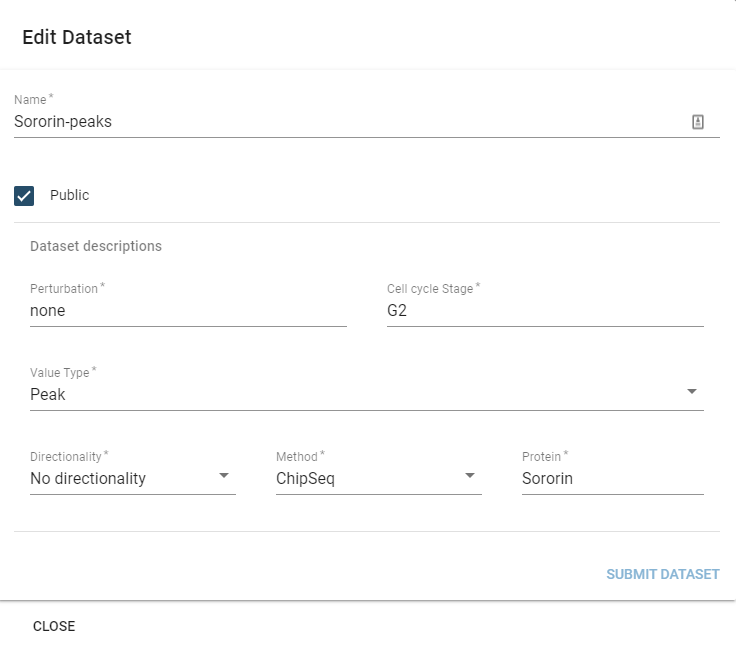
The only parameter you cannot edit is the SizeType field, which would invalidate prior preprocessing on the dataset.
Deleting
You can delete datasets by selecting them in the table and then hitting the Delete button.
Note that you can only delete a dataset when you are its owner, not when it has been shared (see the dataset sharing section for more information) with you.
Deleting a dataset will cause all preprocessing data to be lost. Be careful!