2D-average
The 2D-average widget can be used to display the average magnitude of a 2D-genomic feature over a specific region set. It is a heatmap representation of the underlying aggregated data.
Suitable data
The 2D-average widget is suitable for any genomic dataset that can be represented using a multiresolution cooler file. This is primarily suitable for Hi-C data but can also include other data sets that assign a value to a tuple of genomic coordinates.
Preprocessing algorithm
Point-regions
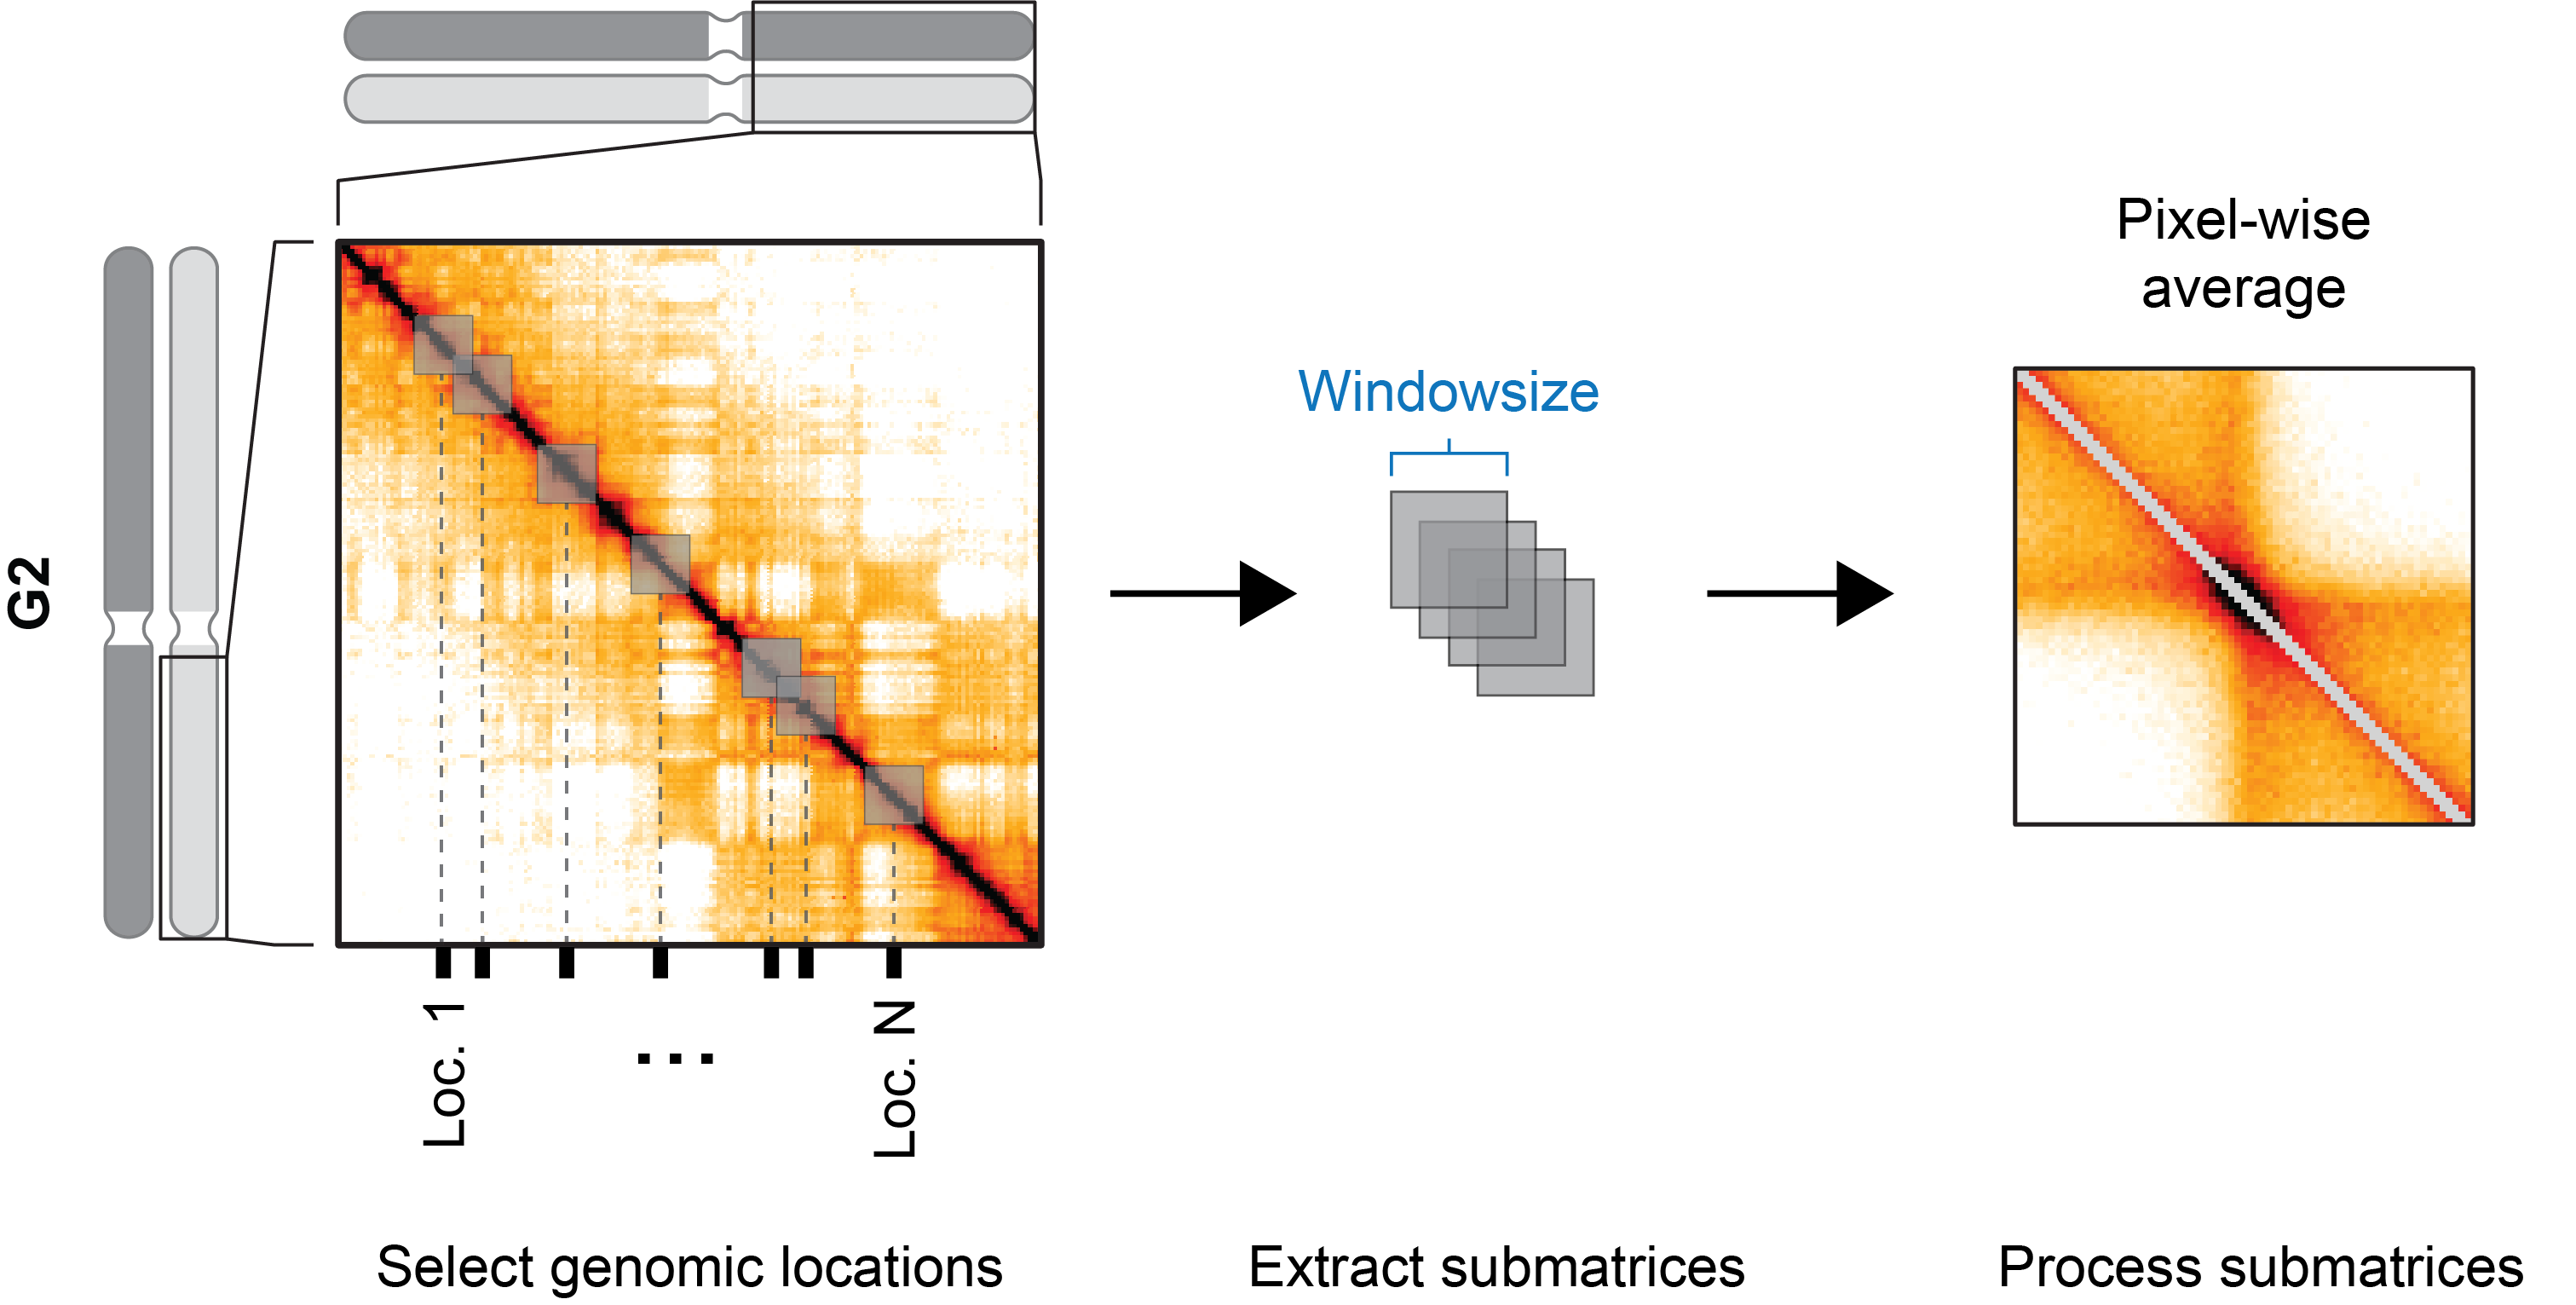
During the preprocessing state, snippets of the underlying interaction matrix are extracted from the mcool file for each entry in the genomic region set, with different window sizes. These snippets are then stacked “behind” each other and reduced pixel-wise to yield an average 2D picture.
Interval-regions
During the preprocessing stage, snippets of the underlying interaction matrix are extracted for each entry in the genomic region set. In contrast to the point-region preprocessing, the snippets are defined by each region’s start and end. Since the matrices are then of differing size, they are first scaled to a common number of bins before stacking and pixel-wise reduction.
Visualization
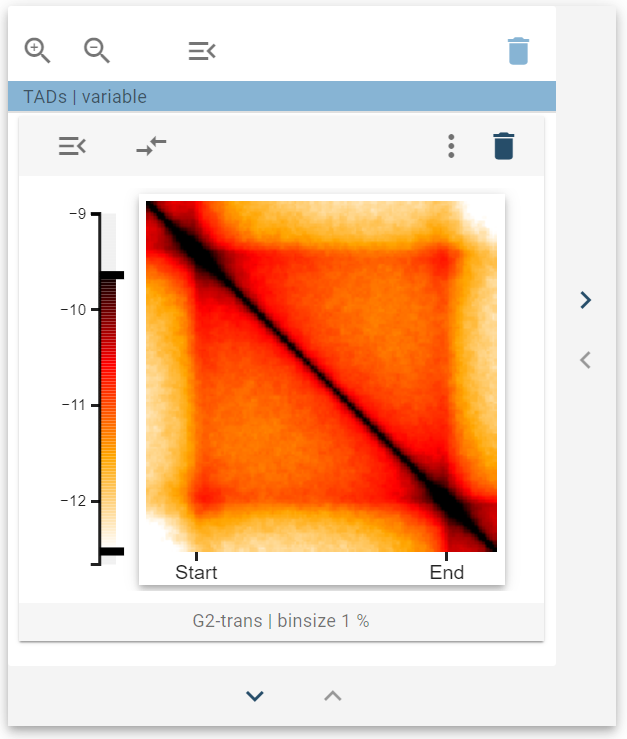
The 2D-average widget displays aggregated data sets as a heatmap. The color scale used to display the values is dynamic and can be adjusted with the sliders at the top and bottom of the color bar.
Widget controls
The 2D-average widget defines two widget controls, one for setting the type of value-scale and the other for sharing value scales between widgets.
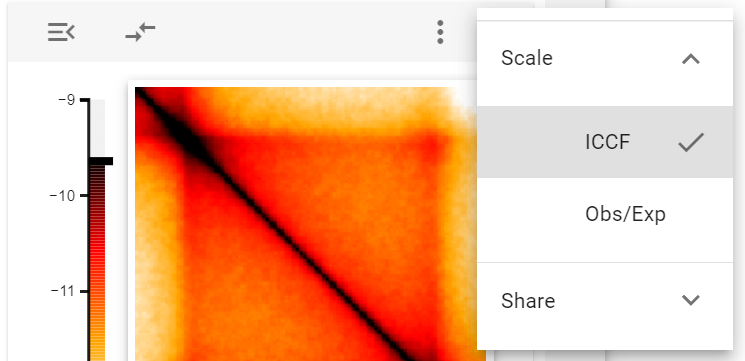
Scale
The scale widget control allows to switch between ICCF values (I teratively C orrected C ontact F requency) and Observer/expected values, which were normalized to the genome-wide distance-dependent decay of contact frequency.
Share value scale
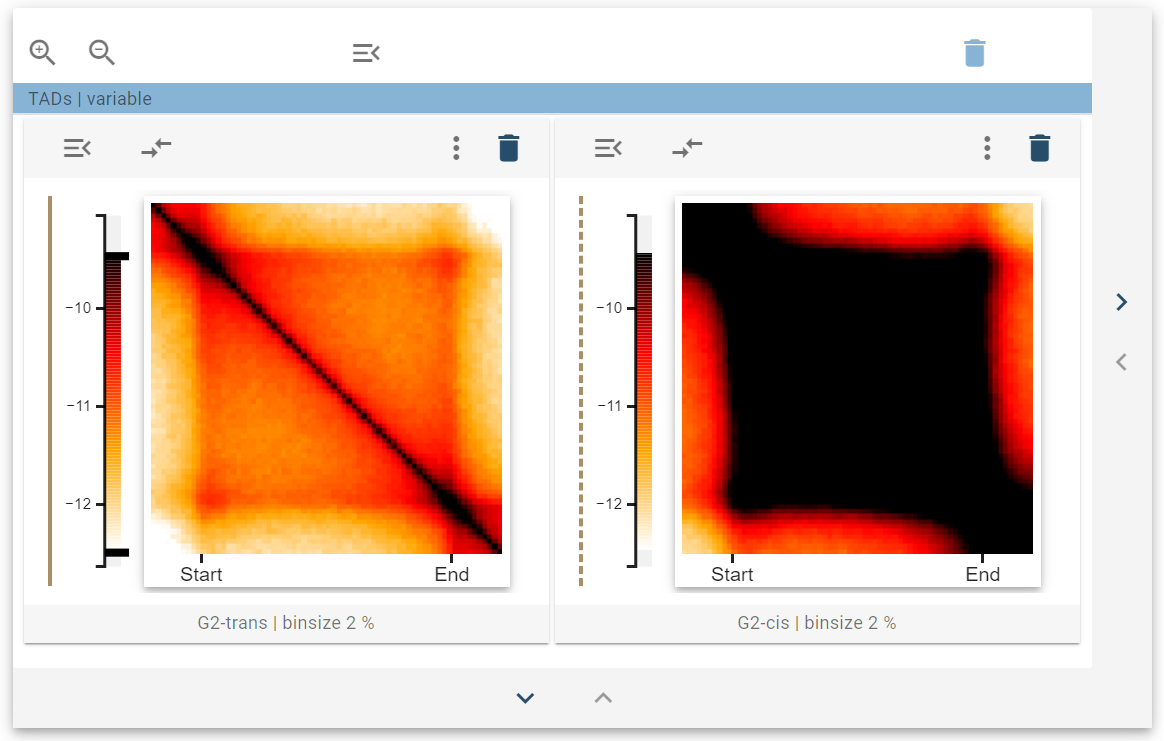
With the share value scale control, the value scale for the colormap can be taken from another 2D-average widget to facilitate comparison. For this, first, select the Take value scale from control and select another 2D-average widget.
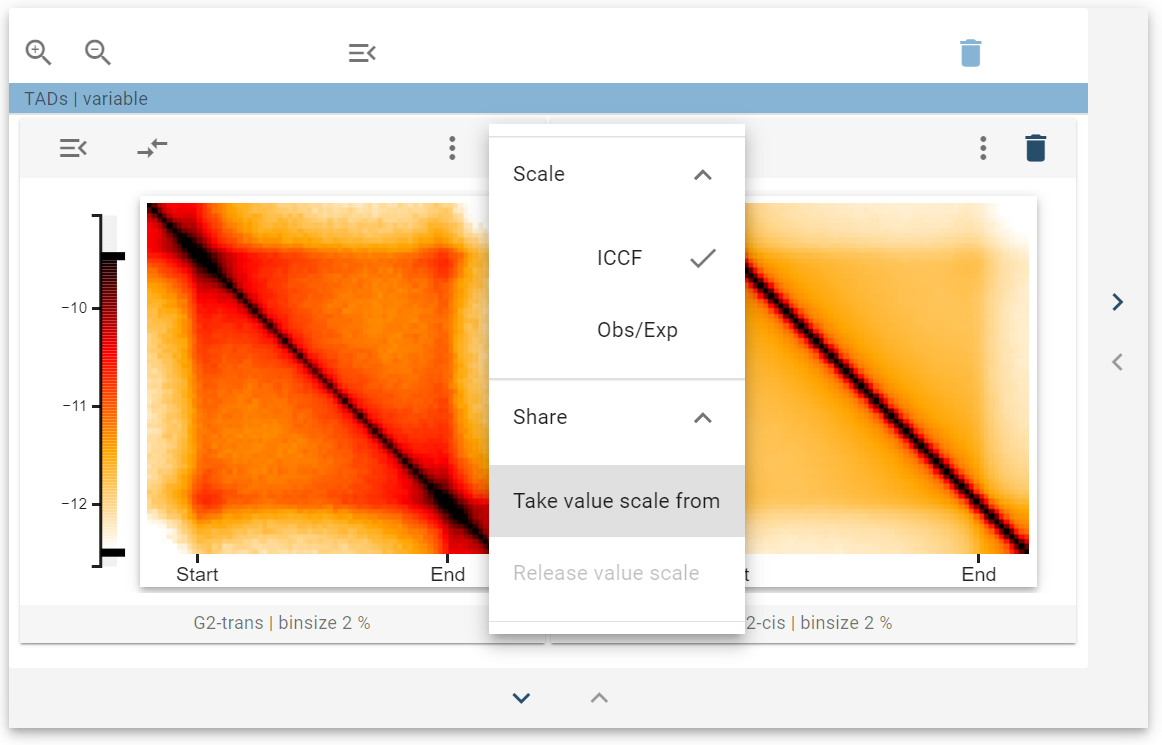
After that, a colored line next to the color bars indicates that the two widgets are linked. The colormap donor has a continuous colored line, whereas the colormap acceptor has a dashed colored line.
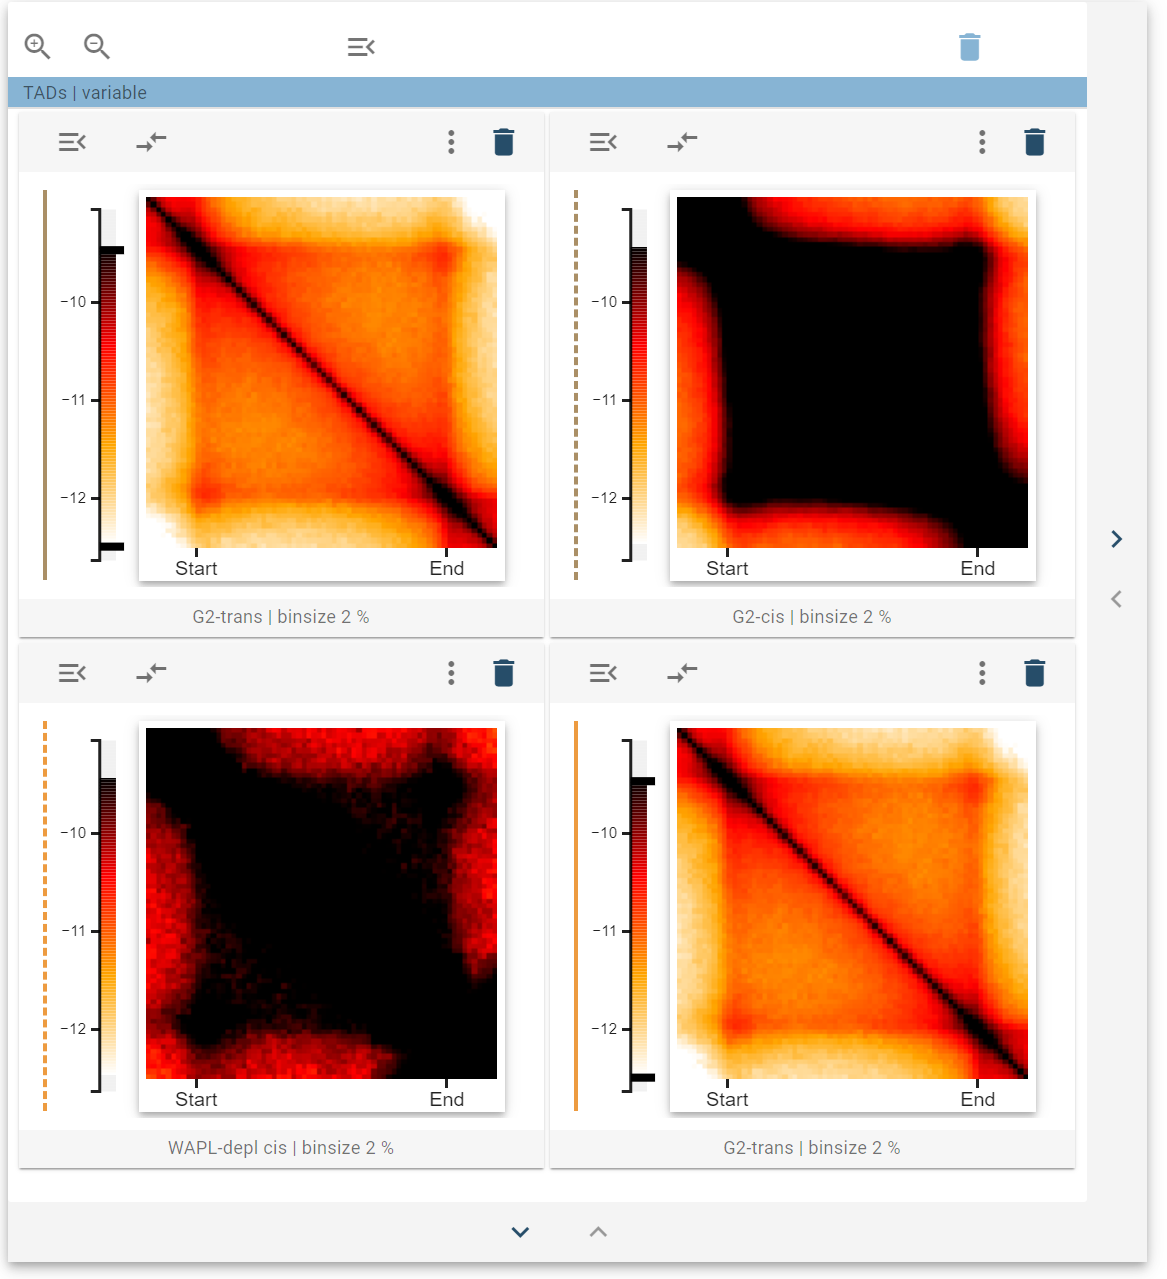
When the color bar sliders are changed at the donor, the acceptor changes the color scale accordingly. You can link multiple widgets together by taking the color scale of the same shared donor. You can also link multiple widgets independently, which then are marked by differently colored color lines.
If you want to stop sharing color scales, you can select “Release value scale” on the color scale acceptor.