Background
Genomic data exploration
The advent of high throughput sequencing has not only enabled researchers to assemble a multitude of different genomes but also firmly established sequencing-based readouts as tools to quantify genome function. This capability has sparked the ENCODE project (Encyclopedia of DNA Elements) that aims to segment genomes into discrete functional units such as genes, insulators, and enhancers based on an extensive catalog of quantitative genomics datasets. Through this and other resources, researchers can draw upon a wealth of genome annotations and integrate them with their own datasets. This approach has become particularly important in spatial genomics, where researchers aim to understand determinants of the 3D structure of genomes by relating conformation capture datasets with genome annotations and quantitative genomics datasets. This task is particularly difficult because it requires the relation of a high-dimensional and variable readout with many potentially associated datasets. Thus, researchers often resort to an initial visual exploration phase to narrow down potential associations.
Genome browsers are amongst the most prominent tools used for this task and allow non-programmers to quickly explore multidimensional datasets by relating genomic tracks to each other and offer the capability to manage genomic datasets. These tools, however, only allow exploration of a limited set of views and thus make it challenging to visualize behavior at multiple related genomic regions. More specialized tools have been developed recently to partially solve this problem, namely HiPiler as a standalone GUI and Piling.js as a javascript framework. These tools allow manipulation and aggregation of a small set of 1D- or 2D genomic regions via the concept of a visual pile. While these tools have introduced important visual concepts, there are practical challenges when analyzing real-world genomic data, where sets of regions of interest routinely surpass 50,000 entries.
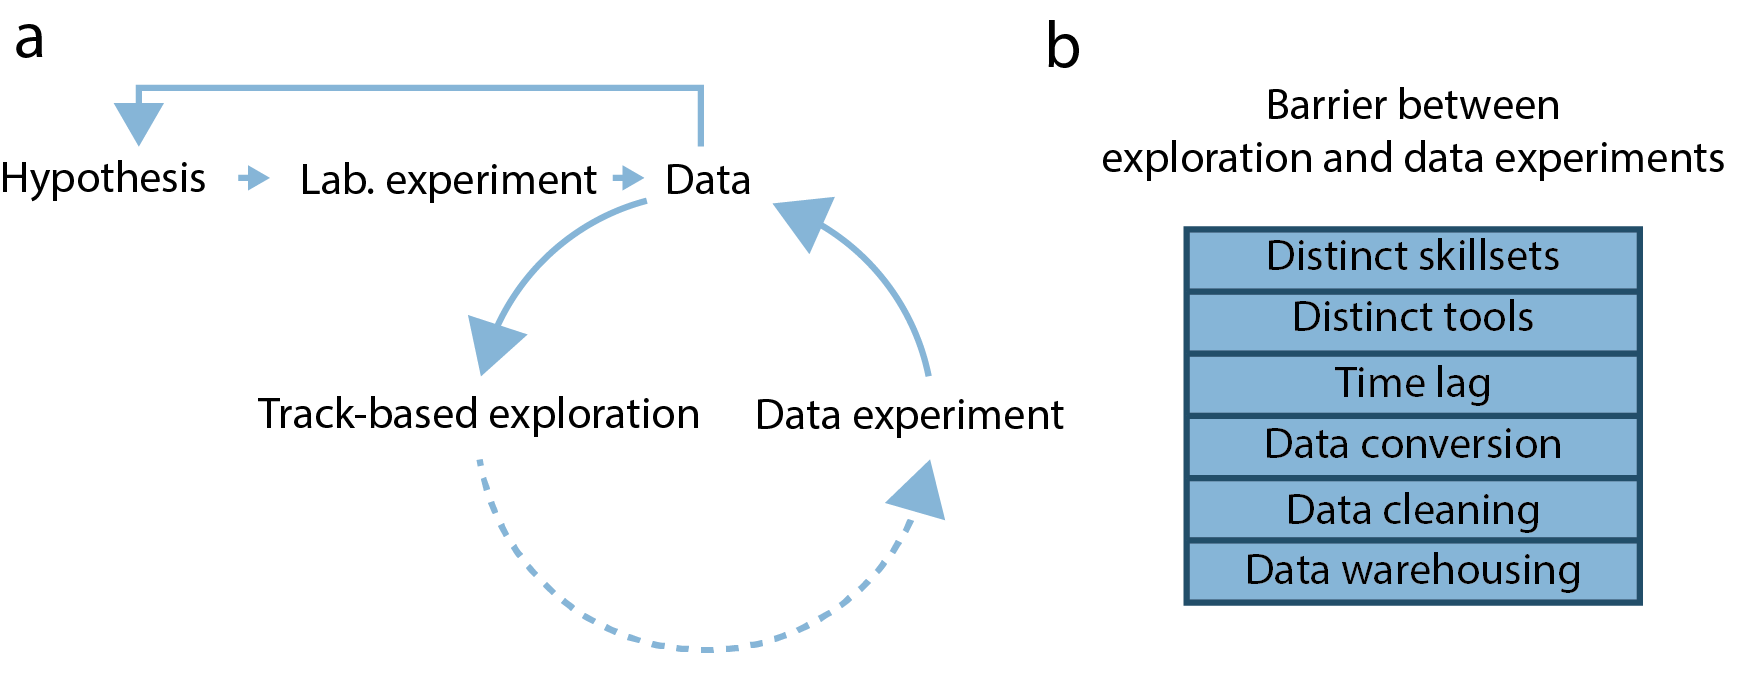 Fig. 1
Genomic analysis cycle: The status-quo
Following this initial data exploration phase, quantitative analysis of genomic datasets is carried out using frameworks in scripting languages. This is done either by programming directly or via integration into tools that allow automatic dispatch, such as galaxy. These tools offer a wide range of functionality and flexibility, which comes at the cost of slow exploration since one needs to write custom code for each new exploration idea.
Thus, the task of relating genomic function to 3D structure often follows an implicit analysis cycle (Fig. 1a). First, researchers use track-based exploration to get an overview of the genomic datasets available for their particular problem. Here, multiple genomic tracks (continuous or discrete values mapped to genomic coordinates) are viewed together in a suitable genome browser and explored by panning and zooming. Researchers then need to integrate knowledge of the biological problem with multiple explored tracks to formulate hypotheses about the aggregate behavior of data (data hypotheses). These hypotheses are then tested by aggregate analysis using scripting languages, leading to re-assessment of the genomic tracks and formulation of refined data hypotheses.
Drawbacks of this approach
Interface between exploration and analysis
This approach of analyzing genomic data presents multiple problems (Fig. 1b). First, separating the exploration of genomic data from testing data hypotheses creates an interface that needs to be bridged. Here, analysts need to switch analysis tools to perform both tasks, increasing the threshold of testing data hypotheses and prolonging the required analysis time. This is a particular problem when biologists with limited scripting experience perform track-based exploration. In that case, they need to rely on a bioinformatician to complete their data hypothesis testing, incurring long wait times and communication overheads.
Quality of hypotheses
The second problem using track-based exploration is that the quality of possible data hypotheses is likely limited. This is partly because simultaneous viewing of multiple genomic tracks is akin to finding patterns in a multidimensional dataset, a task that humans are notoriously bad at. Additionally, track-based exploration only allows viewing of a limited number of associations simultaneously, posing the danger of missing rare associations and proposing spurious ones. Thus, track-based exploration is not an ideal analysis approach for multidimensional genomic data.
Last but not least, a well-established principle that any visual system should follow is Schneiderman’s mantra: overview first, zoom and filter, then details-on-demand. However, a track-based system is ill-suited to give an overview since, per definition, it focuses on the details of a single region. It mainly helps us detect anomalies but can not give us an overview or explicitly display its properties and pattern on a system-wide level.
HiCognition can help solve these problems
In order to overcome this problem, we conceptualized the region-set focus approach and implemented it in HiCognition.