1D-average
The 1D-average widget can be used to display the average magnitude of a 1D-genomic feature over a specific region set. It is a simple line-profile visualization that can load one or more genomic datasets and implements a simple tooltip that shows the magnitude of the specific data sets.
Suitable data
The 1D-average widget is suitable for any genomic dataset that can be represented using a bigwig file. This includes coverage tracks for Chip-seq experiments, Gro-seq experiments, and features derived from Hi-C data, such as insulation scores.
Preprocessing algorithm
Point-regions
Snippets are extracted from the respective bigwig file for each entry in the genomic region set, with different window sizes during the preprocessing stage. These snippets are stacked row-wise into a matrix and reduced column-wise to produce a single value per bin.
Interval-regions
Snippets are extracted from the respective bigwig file for each entry in the genomic region set during the preprocessing stage. In contrast to the point-region preprocessing, the snippets are defined by each region’s start and end. Before stacking, each snippet is scaled to have the same number of bins. Then they are stacked row-wise into a matrix and reduced column-wise to produce a single value per bin.
Visualization
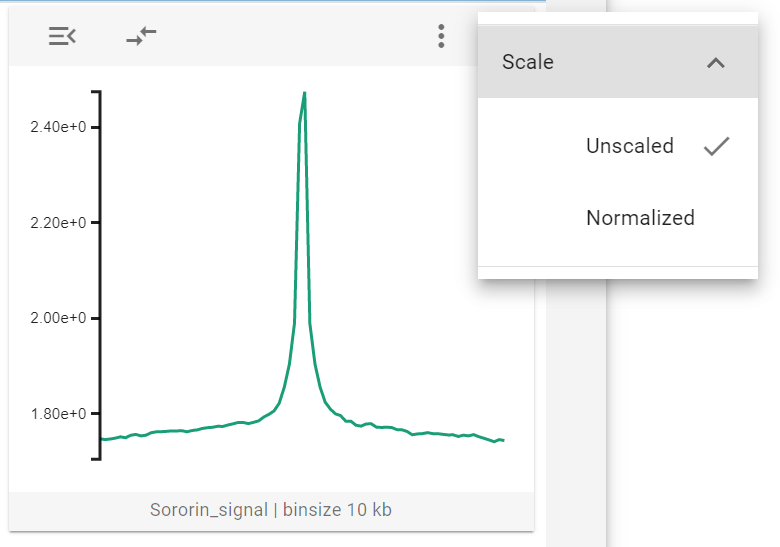
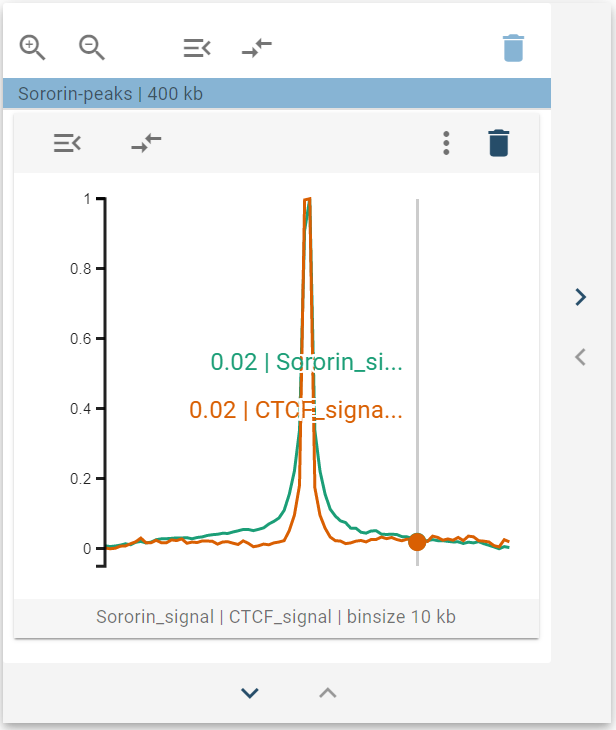
The 1D-average widget displays aggregated data sets as a line profile, which plots the specific value for a genomic bin against its relative position with regards to the center. If you hover over the widget, a tooltip is displayed that reads the magnitude of the respective lines.
Widget controls
The 1D-average widget has a single widget control option - called Scale - which allows users to normalize the displayed data to lie between 0 and 1. This is helpful when comparing multiple features.